Capturing Cross-Border Mobilities of People:
A Twitter study
Håvard Wallin Aagesen, Olle Järv, Ate Poorthuis
Mobility &
Cross-border Regions in Europe
- 150 million people live close to borders
- Border regions mostly omitted in spatial research
- Country-specific, as silos
- Less attention on people beyond migration
Knowledge Gap
- Who crosses borders & why?
- Where & when borders are crossed?
- How (un)expected events like COVID-19 influence?
- How mobility of people form functional border regions?
- Lack of data
First studies indicate the feasibility of the approach
Scaling up the research
→ European level
- Examine the feasibility of the approach to study border regions at European level
- Characterize border regions from the perspective of C-B mobility
Methodology
Data
- Geolocated Tweets in Europe
- 2012-2022
- Ca 14 million users
- Ca 4 billion Tweets
Data
- Geolocated Tweets in Europe
- 2012-2022
- Ca 14 million users
- Ca 4 billion Tweets
Movement detection
- Max duration 45 days
- Max distance 300km
- ~ 3 million C-B movements
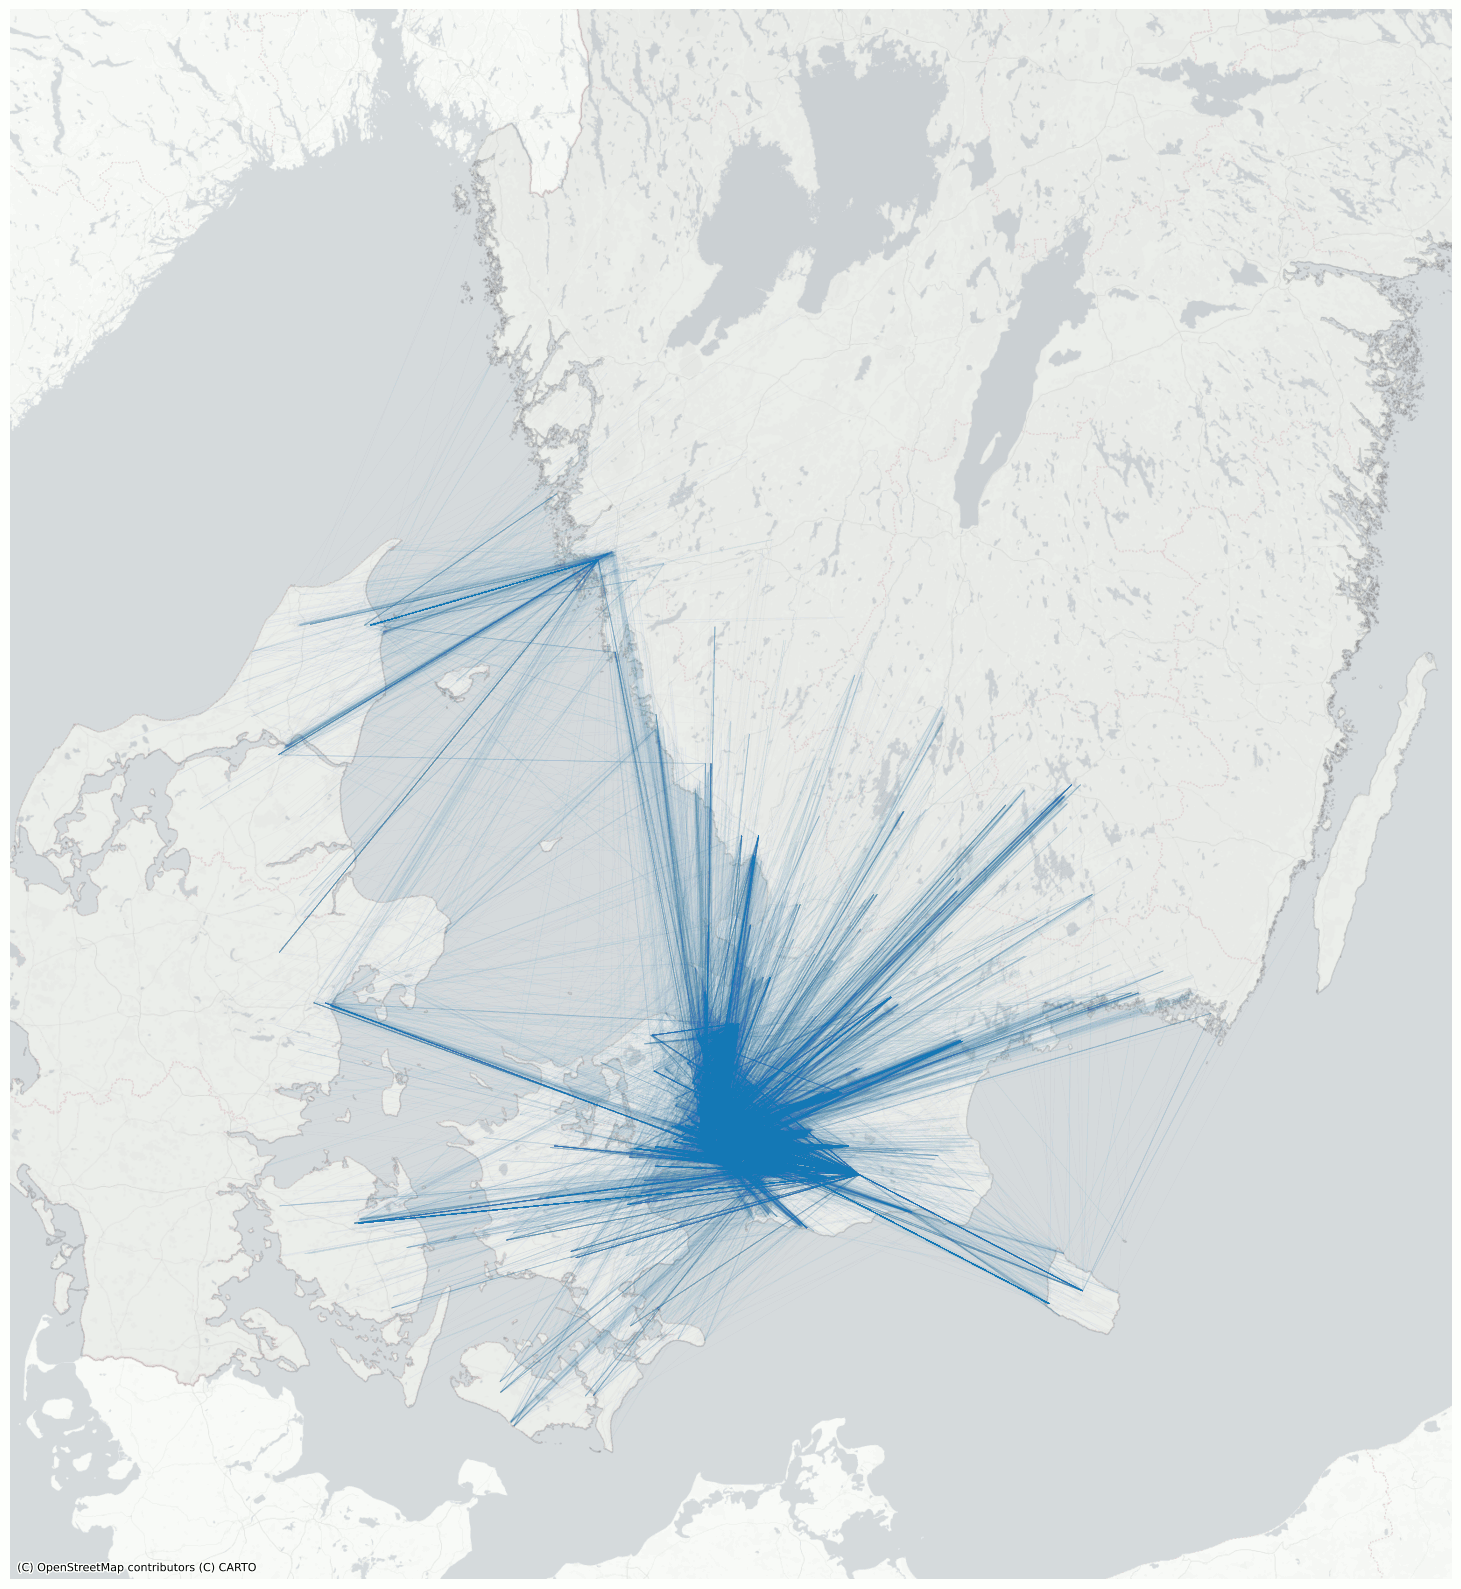
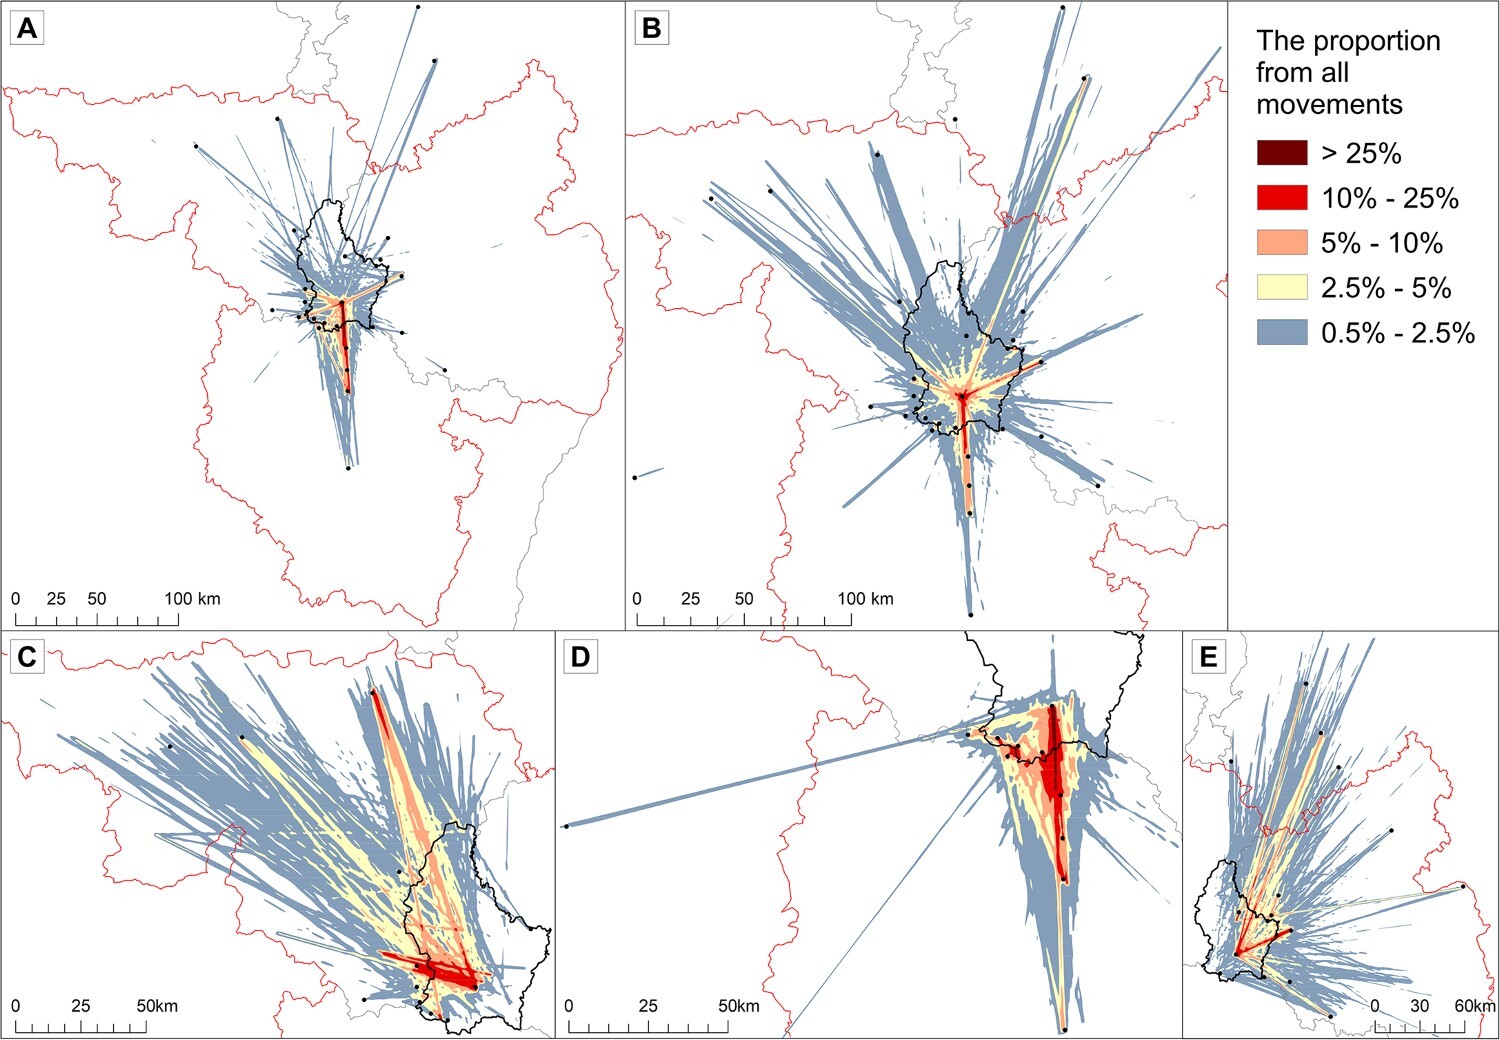
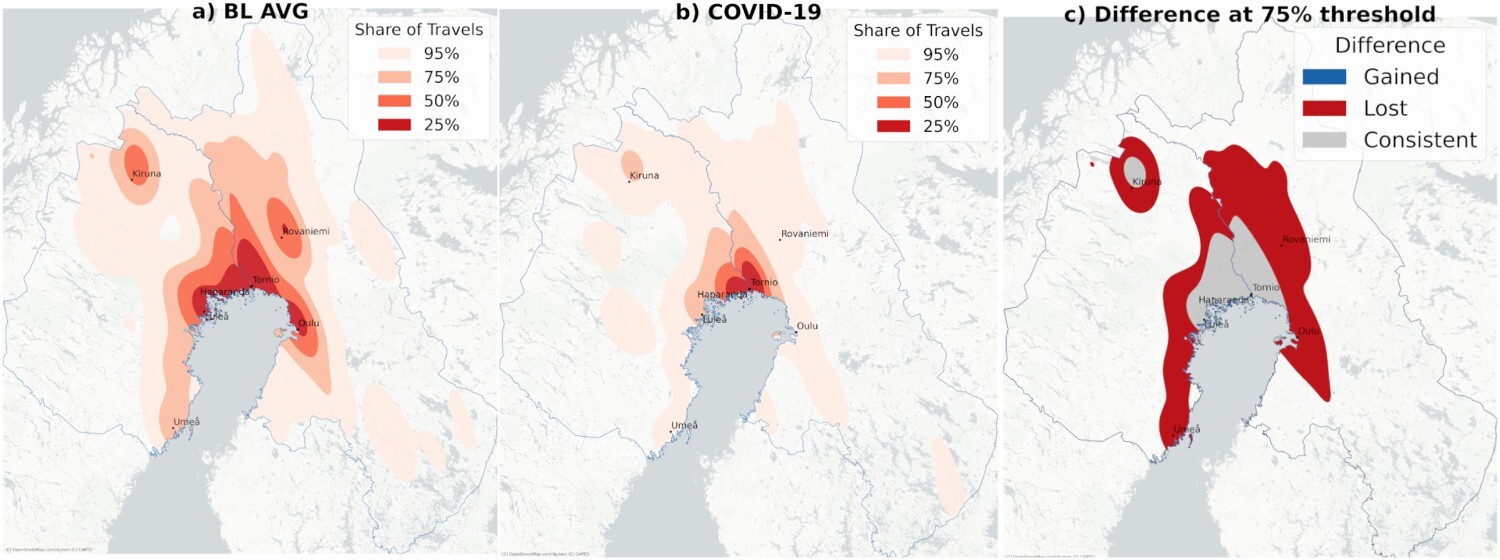
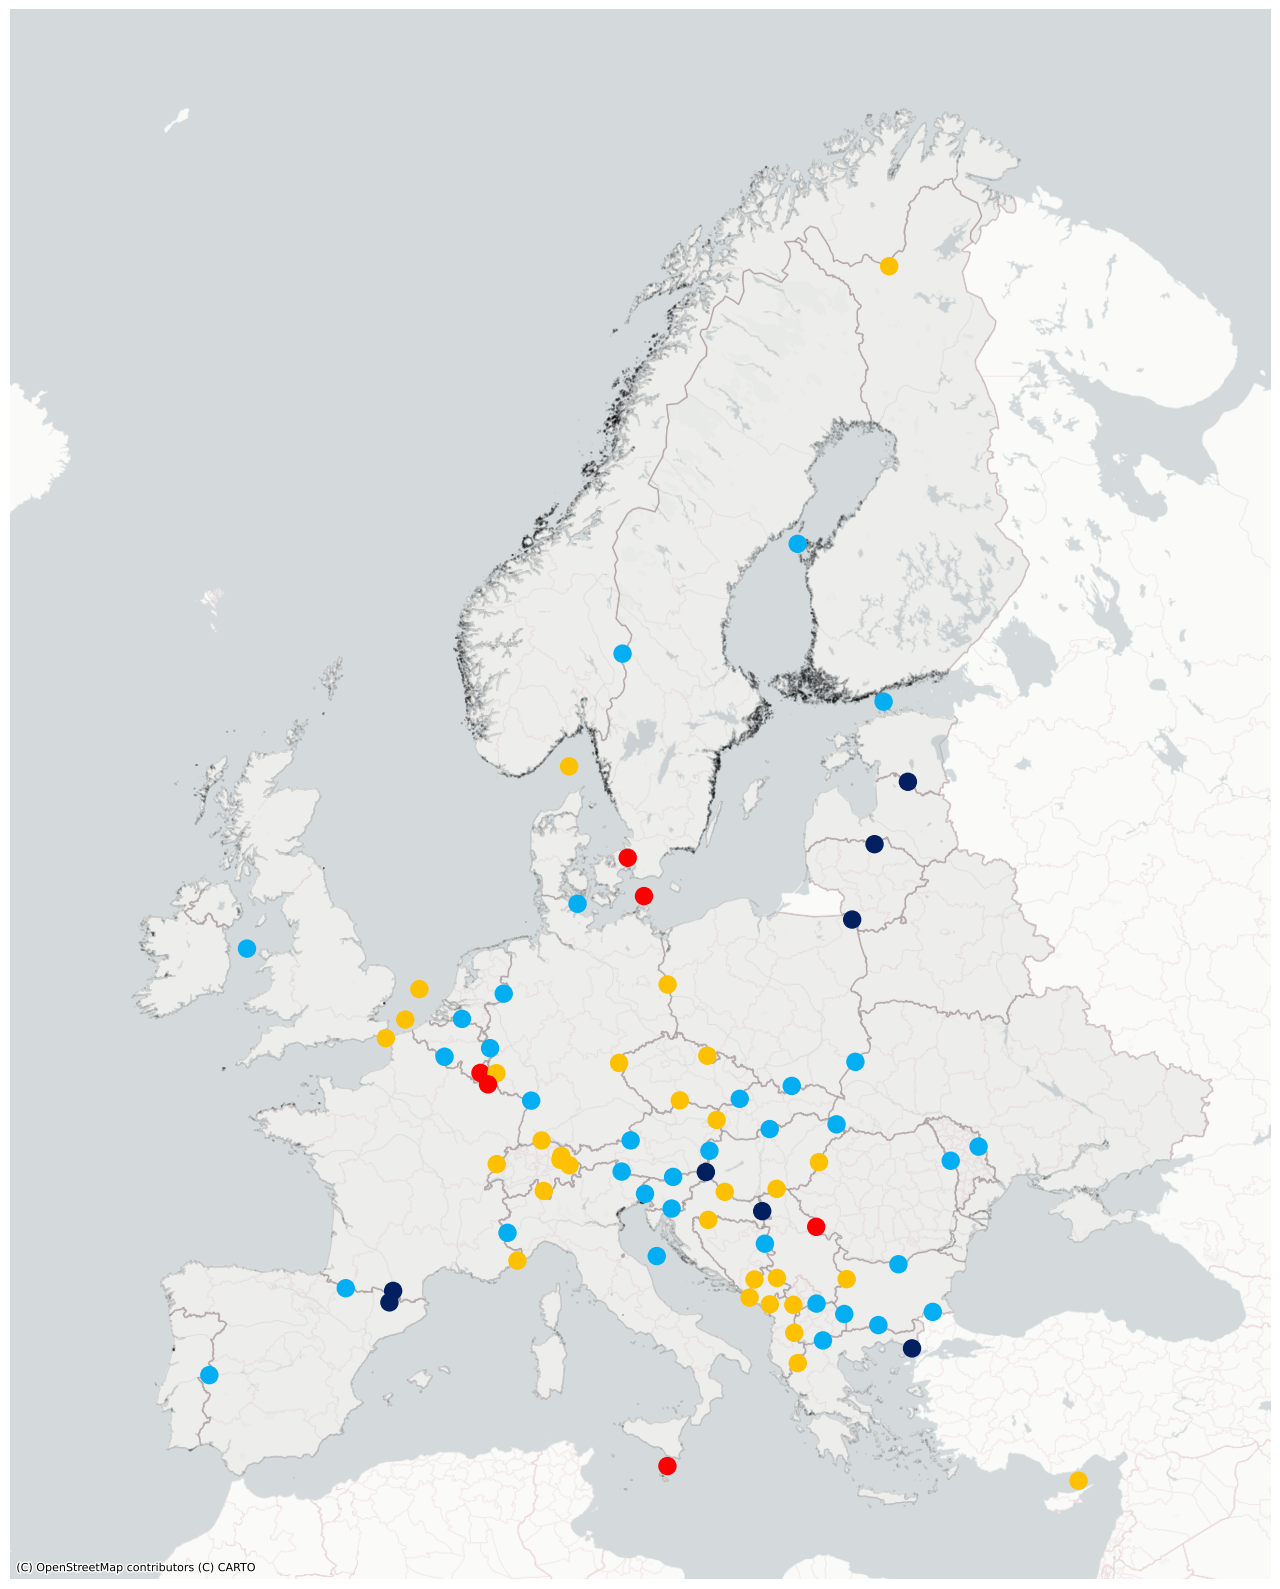
Characterizing border regions
by frequent weekly mobility
Characterizing border regions
by frequent weekly mobility
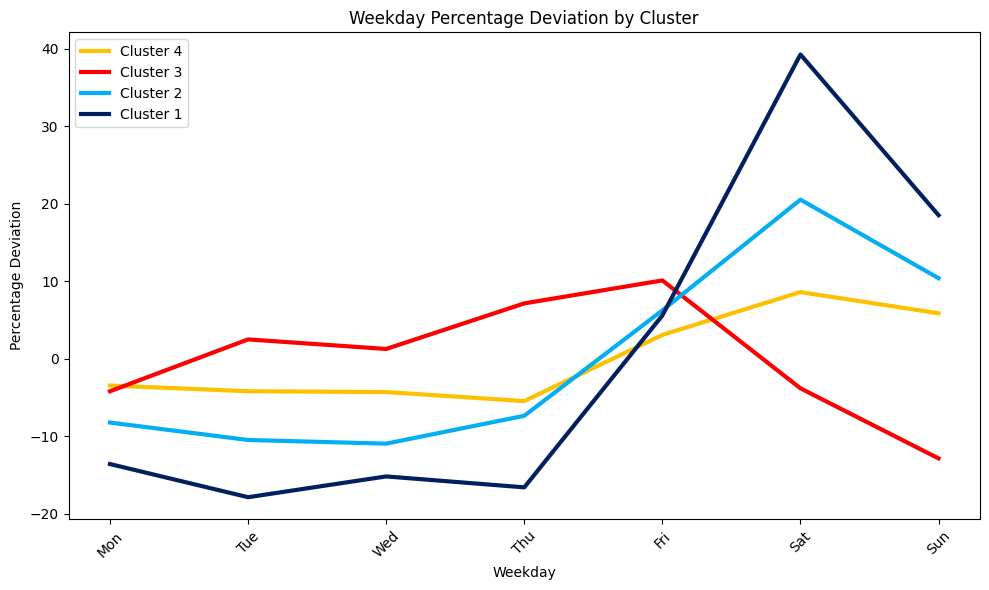
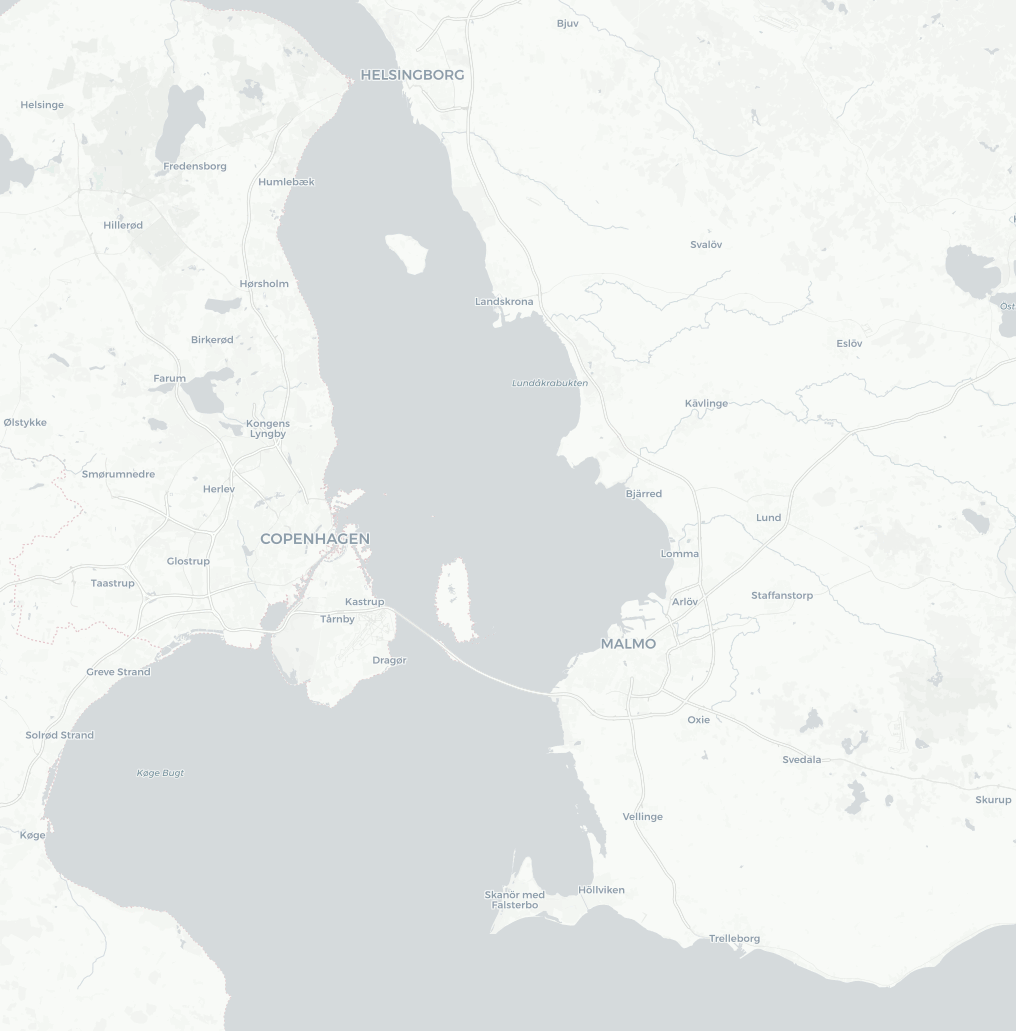
Example:
Denmark - Sweden
Take home messages
- Mobility approach is feasible to characterize border regions in Europe
- Provide the dynamic perspective of people
- Simple and robust methodology, but how reliable are the findings?
Future steps
- Adding place of residence and directionality
- Comparing with socio-economic factors
- Implications to policy and planning of border regions
 havard.aagesen@nmbu.no
 +
+
 haavardaagesen